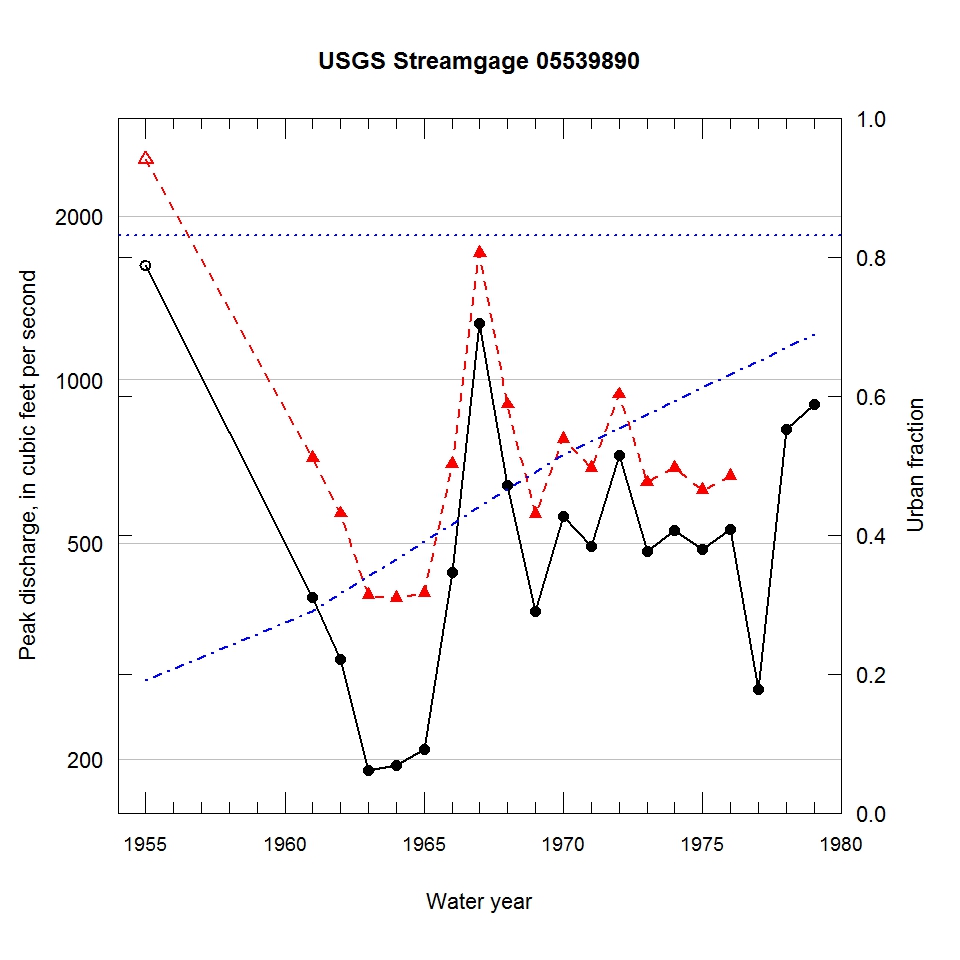
Observed and urbanization-adjusted annual maximum peak discharge and associated urban fraction and precipitation values at USGS streamgage:
05539890 WEST BRANCH DU PAGE RIVER NEAR WAYNE, IL


| Water year | Segment | Discharge code | Cumulative reservoir storage (acre-feet) | Urban fraction | Precipitation (inches) | Observed peak discharge (ft3/s) | Adjusted peak discharge (ft3/s) | Exceedance probability |
| 1955 | 1 | 7 | 0 | 0.190 | 3.051 | 1620 | 2540 | 0.007 |
| 1961 | 1 | -- | 0 | 0.290 | 1.310 | 397 | 717 | 0.431 |
| 1962 | 1 | -- | 0 | 0.315 | 0.276 | 306 | 567 | 0.649 |
| 1963 | 1 | 2 | 0 | 0.340 | 1.218 | 191 | 401 | 0.883 |
| 1964 | 1 | -- | 0 | 0.365 | 1.754 | 195 | 396 | 0.888 |
| 1965 | 1 | -- | 0 | 0.390 | 0.131 | 209 | 405 | 0.879 |
| 1966 | 1 | -- | 0 | 0.415 | 1.305 | 442 | 699 | 0.455 |
| 1967 | 1 | -- | 0 | 0.440 | 1.198 | 1270 | 1710 | 0.021 |
| 1968 | 1 | -- | 0 | 0.465 | 1.564 | 638 | 900 | 0.214 |
| 1969 | 1 | -- | 0 | 0.490 | 1.347 | 375 | 565 | 0.655 |
| 1970 | 1 | -- | 0 | 0.515 | 1.489 | 560 | 778 | 0.348 |
| 1971 | 1 | -- | 0 | 0.535 | 0.368 | 494 | 687 | 0.473 |
| 1972 | 1 | -- | 0 | 0.554 | 1.385 | 726 | 939 | 0.190 |
| 1973 | 1 | -- | 0 | 0.573 | 0.772 | 482 | 646 | 0.531 |
| 1974 | 1 | -- | 0 | 0.593 | 0.620 | 528 | 688 | 0.471 |
| 1975 | 1 | -- | 0 | 0.612 | 0.837 | 487 | 626 | 0.560 |
| 1976 | 1 | -- | 0 | 0.631 | 1.152 | 530 | 664 | 0.506 |
| 1977 | 0 | -- | 230 | 0.650 | 0.624 | 269 | -- | -- |
| 1978 | 0 | -- | 230 | 0.670 | 1.384 | 808 | -- | -- |
| 1979 | 0 | -- | 230 | 0.689 | 0.827 | 900 | -- | -- |

